ARA Dashboard
What is The ATL’s Annual Report and Audit?
The ATL 2019 Annual Report and Audit (ARA) is the first comprehensive report of transit performance, planning, funding, and operations within the ATL’s 13-county region. The report, available here, evaluates the region’s transit services using key performance indicators (KPIs) to paint a comprehensive picture of transit performance in the Atlanta region and assesses/analyzes the economic impacts of transit on the region’s economy.
Below are visualizations of select KPIs documented in the ARA: Ridership (both annual ridership and passengers per revenue hour), on-time performance, and vehicles past their useful life benchmark (ULB). These dashboards are interactive, and we encourage you to click on different metrics and modes to gain a more detailed understanding of the region’s transit performance and conditions. The graphs are based on data provided in Fall 2020 and will be updated annually as part of the ARA process.
Ridership
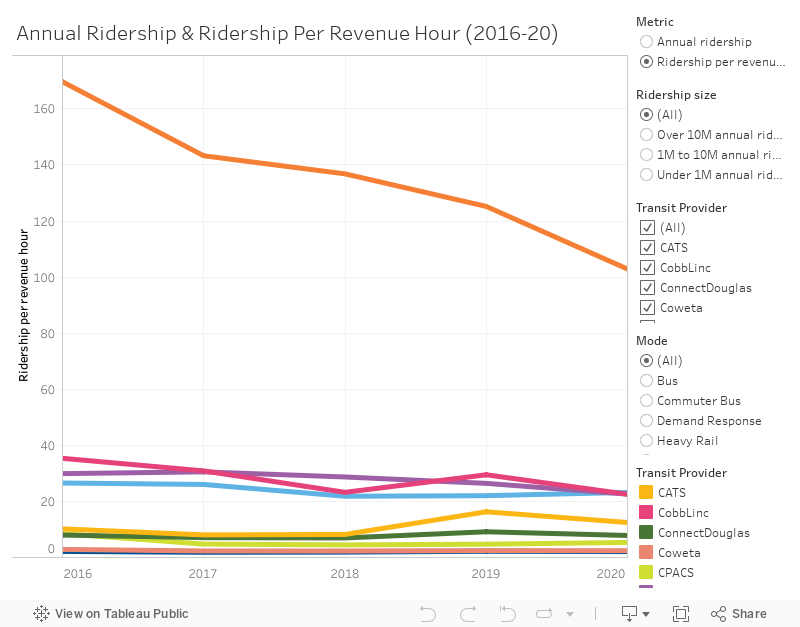
Transit Ridership in the ATL Region
This graph shows annual transit ridership in the Atlanta region, broken down by provider and/or mode. Changing the selection under “Metric" allows you to view ridership per revenue hour—either for one specific mode or for all modes.
Because MARTA services have the largest share of the region’s transit ridership, the presence of MARTA’s line significantly condenses the visualization. Filtering by ridership size or unchecking the box next to MARTA under “Transit Provider” will hide MARTA data and provide a clearer picture of ridership on the region’s other providers.
In Fiscal Year 2020 (running from July 2019 through June 2020), the region’s transit network provided over 100 million trips to residents and visitors. While declines in total transit ridership were lower between 2018 and 2019 than between previous years, 2020 saw a sharper decline. This was largely a result of the COVID-19 pandemic.
Due to the ongoing nature of the pandemic, many people in the region continue to telework to avoid using transit, so ridership is expected to continue its downward trend in FY 2021. Still, the ATL is working to increase ridership by creating connections across the region and across operators.
Glossary
Fixed-route bus: Public transportation on which a vehicle is operated along a prescribed route according to a fixed schedule.
Commuter bus: A type of bus service that predominantly operates in one direction during peak periods, making limited stops, usually between suburbs and major employment centers.
On-time Performance
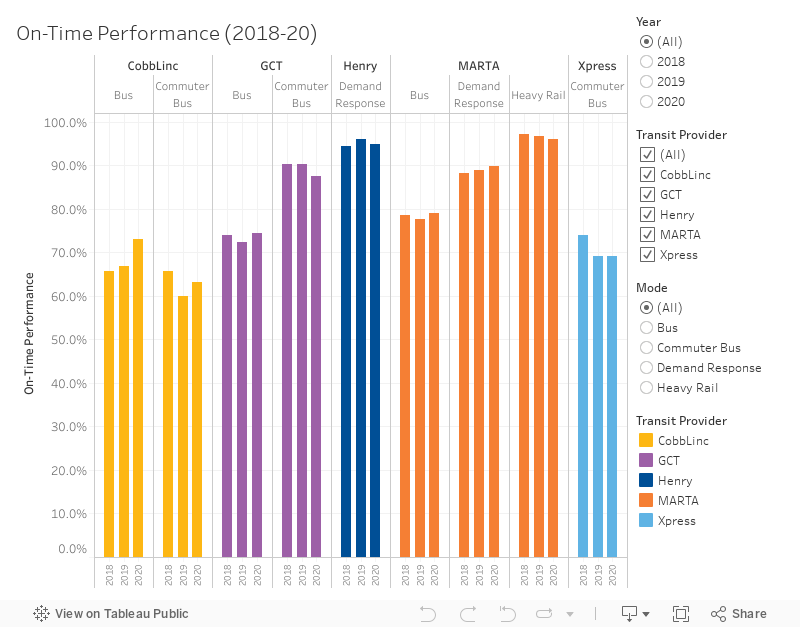
On-time Performance in the ATL Region
This graph shows on-time performance (OTP) for the five transit providers in the Atlanta region that track this metric. Changing the selection under “Mode” will show OTP for a single mode, and changing the selection under “Transit Provider” will hide or show a given provider.
For fixed-route bus, commuter bus, and rail services, “on time” is generally defined as arriving within five minutes of the scheduled time. For demand-response services, “on time” is commonly defined as arriving within 30-minutes of the scheduled pick-up window.
On-time performance is one of the most critical transit performance metrics from a customer perspective: If transit is considered unreliable, travelers will look to other modes of transportation to get to their destinations. Maintaining high on-time performance rates requires reliable traffic conditions and effective operational planning and management. Investments in priority treatments for transit, such as dedicated lanes for buses, can help improve on-time performance.
The Atlanta Regional Commission has established a vision for Transportation Systems Management and Operations (TSMO), which can be found here. The region’s providers continue to improve their performance efficiency, and the ATL is working to improve on-time performance by prioritizing innovative transit projects that increase travel time reliability.
Useful Life Benchmark (ULB)
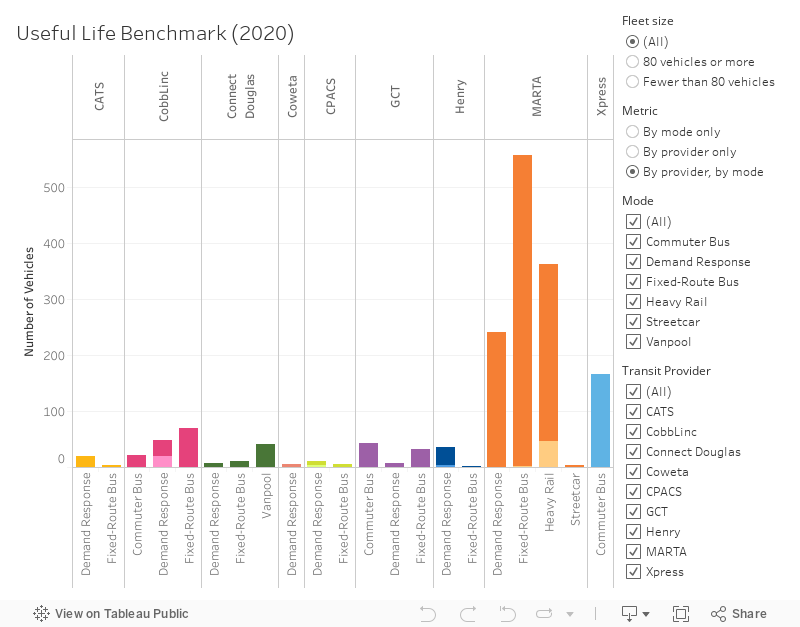
Transit Vehicles Past ULB in the ATL Region
There is a strong correlation between the state of an provider’s vehicle fleet and its reliability of service; vehicles that break down more often lead to less dependable service, which in turn negatively impacts ridership.
A higher percentage of vehicles past the ULB indicates that more of an provider’s fleet is likely to incur maintenance costs or accumulate safety incidents. Although the FTA provides a default ULB, transit providers can adjust these estimates in either direction. A vehicle manufactured in 2020 was considered to be zero years old.
The ATL is working to improve ULBs across the region by coordinating with operators to include state of good repair projects as a part of the Atlanta Regional Transit Plan program of projects.
Glossary
Useful Life Benchmark (ULB), per the FTA, is “the expected lifecycle of a capital asset for a particular transit provider’s operating environment, or the acceptable period of use in service for a particular transit provider’s operating environment.”